
MATERIAL PROPERTIES CONTROL of 3d printed components
Defining quality in additive technologies requires consideration of the high variability of material properties, print settings, post-processing and environmental conditions, all of which can influence the final behaviour of printed parts. Therefore, quality assessment should not rely only on manufacturer datasheets or on basic visual and dimensional inspection. In this context, an optical extensometer provides a useful method for evaluating the actual mechanical response of printed specimens during tensile loading. Thanks to its non-contact optical measurement principle, the evaluation process can be automated, as strain and deformation are recorded directly from image data without physical interaction with the specimen. This approach enables a more detailed assessment of effects related to print orientation, layer bonding and material anisotropy, which are especially important for FDM/FFF printed components.
In principle, a component is affected at three main levels of quality control requirements, abbreviated as QC, according to ISO/ASTM 52927:
- mechanical and thermal properties (material level),
- dimensional and geometric accuracy (dimensional level),
- surface quality and aesthetic value (visual level).
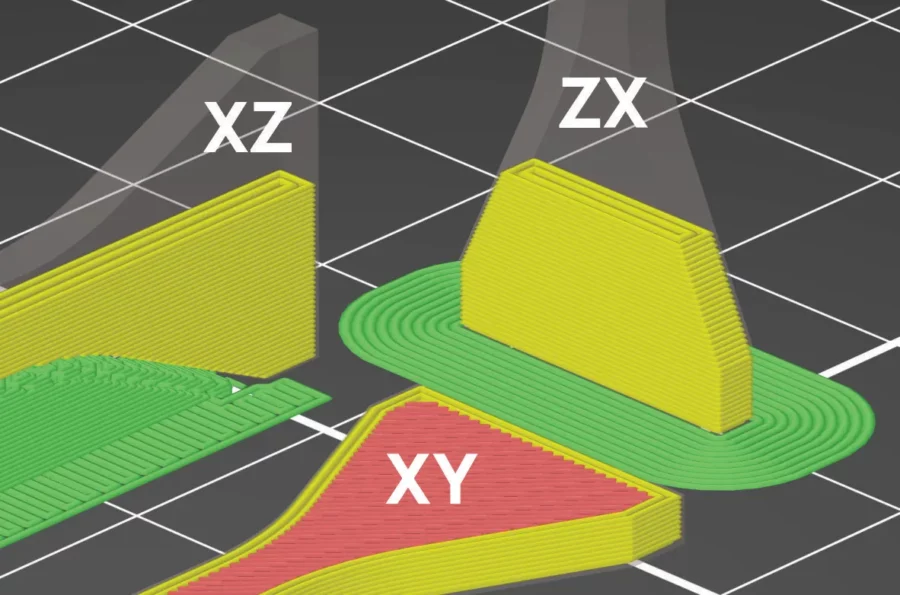
A key factor in 3D printing is material anisotropy caused by print orientation, which results in differences between material properties in different directions. Three principal planes are distinguished: horizontal XY plane and vertical XZ and ZX planes, as seen in Figure 1. Since an FDM/FFF printer does not deposit filaments vertically, the model is held together in the Z-axis only by the adhesive bond between the layers.
KEYWORDS
- 3D Printing
- FDM/FFF method
- Uniaxial tensile test
- Anisotropy phenomenon
- Standard:
- ISO 527-1:2019
- ISO 527-2:2025
TEST SET-UP
- X-Sight-2106 optical extensometer
- PLA and PETG miniature dogbone specimens
- Alpha DIC® modules: AX, PP, DI
- Alpha DIC software tools:
◦ Line Probe
OUTPUT
- Stress-strain diagram (all print orientations)
- Young’s modulus (averaged with standard deviation)
- Material report (test protocol)
Measurement Process and Tools
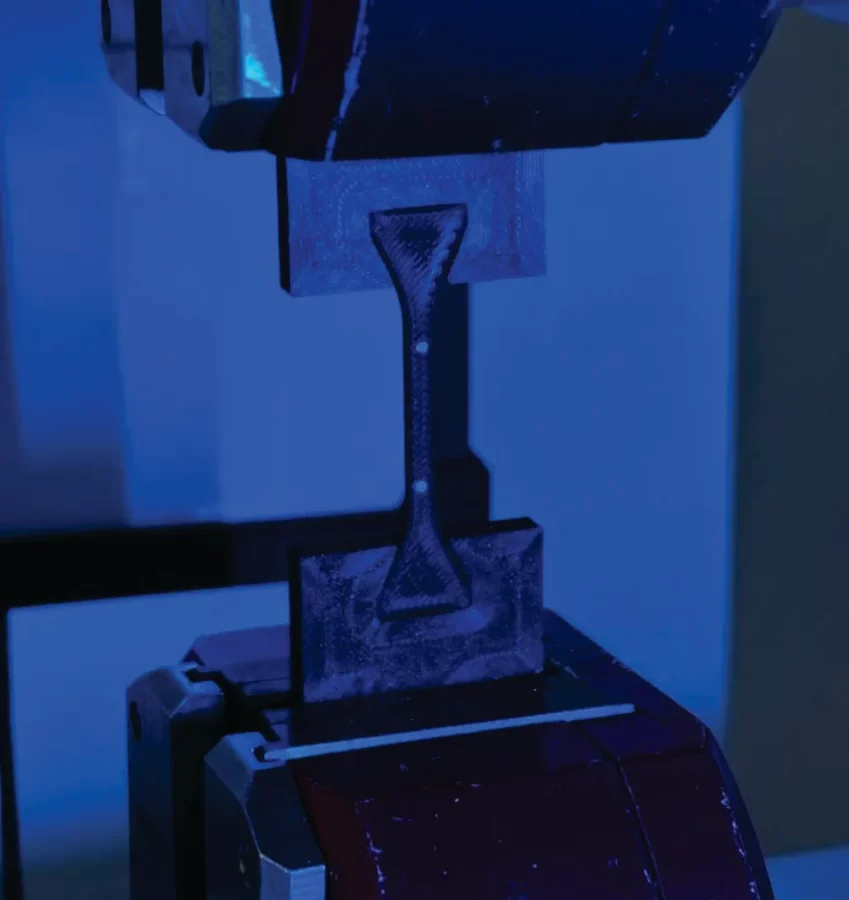
Figure 2 illustrates the small custom-shaped grips that were modelled and 3D printed to hold the test specimens and to allow their ends to be clamped in the standard jaws of the available tensile testing machine.
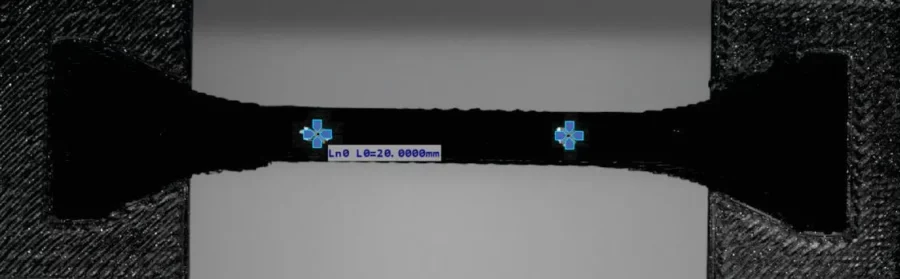
The measured gauge length of the specimen was defined by two white markers, to which a line measurement probe, referred to as the Line Probe in the Alpha DIC software, was attached. This is shown in Figure 3, which illustrates the probe positioned between two markers with a centre-to-centre distance of 20 mm. It was verified that, in the XY and XZ planes, the measurement could also be performed without additional marking due to the pronounced surface texture of the specimens.
Measurement Evaluation
The measured data are subsequently evaluated, and a stress-strain curve is generated for each specimen. In the final stage, the results may be used to issue a material report confirming that the printed components meet the declared mechanical properties for the specified print orientation and process parameters, including the effect of build-orientation anisotropy.
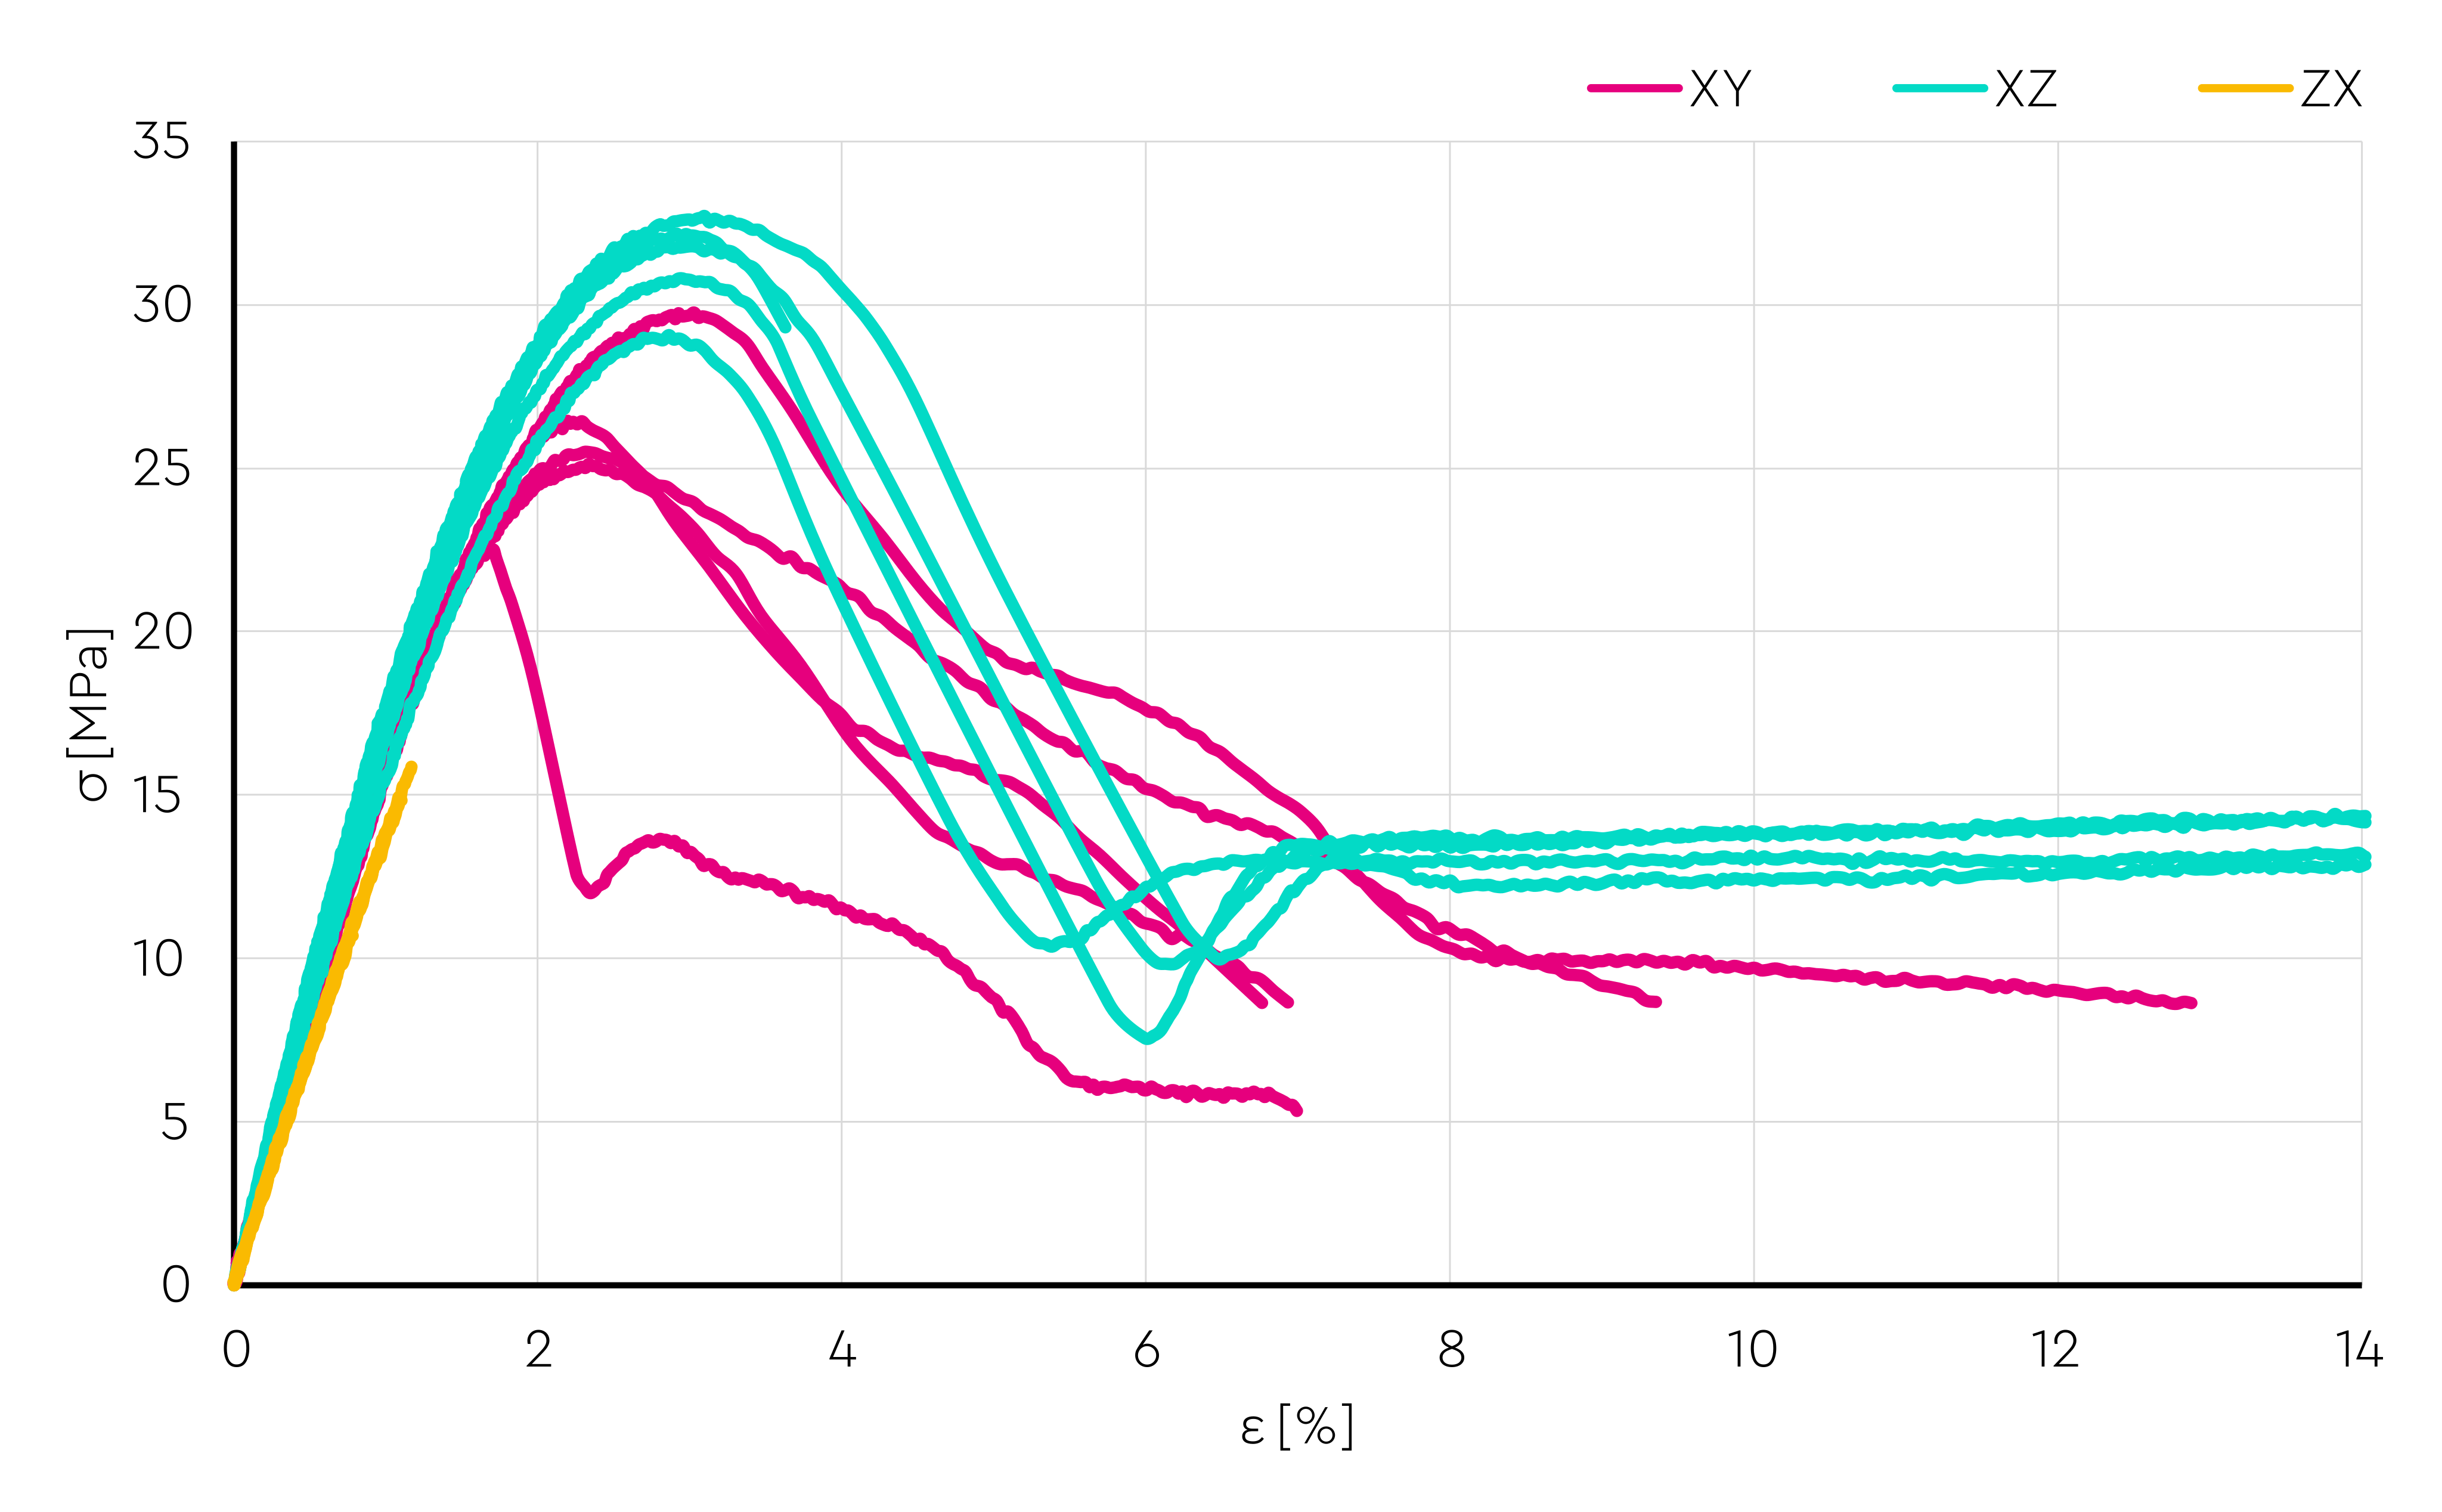
When focusing on the PLA tensile diagrams combined in Figure 4, the expected material behaviour can be observed. The largest plastic region occurs in the horizontal XY plane, followed by the vertical XZ plane. The end of each test indicates brittle fracture, which would likely become more sudden at higher loading rates. The ZX-oriented specimens show an almost linear and weakest response, making them a clear example of loading perpendicular to the layers and subsequent layer delamination.
The PETG stress-strain curves obtained from the tensile tests in Figure 5 confirm the ductile and tough behaviour of this thermoplastic. The highest elongation is observed in the XZ plane, where the strain can reach several tens of percent as a result of prolonged filament stretching.
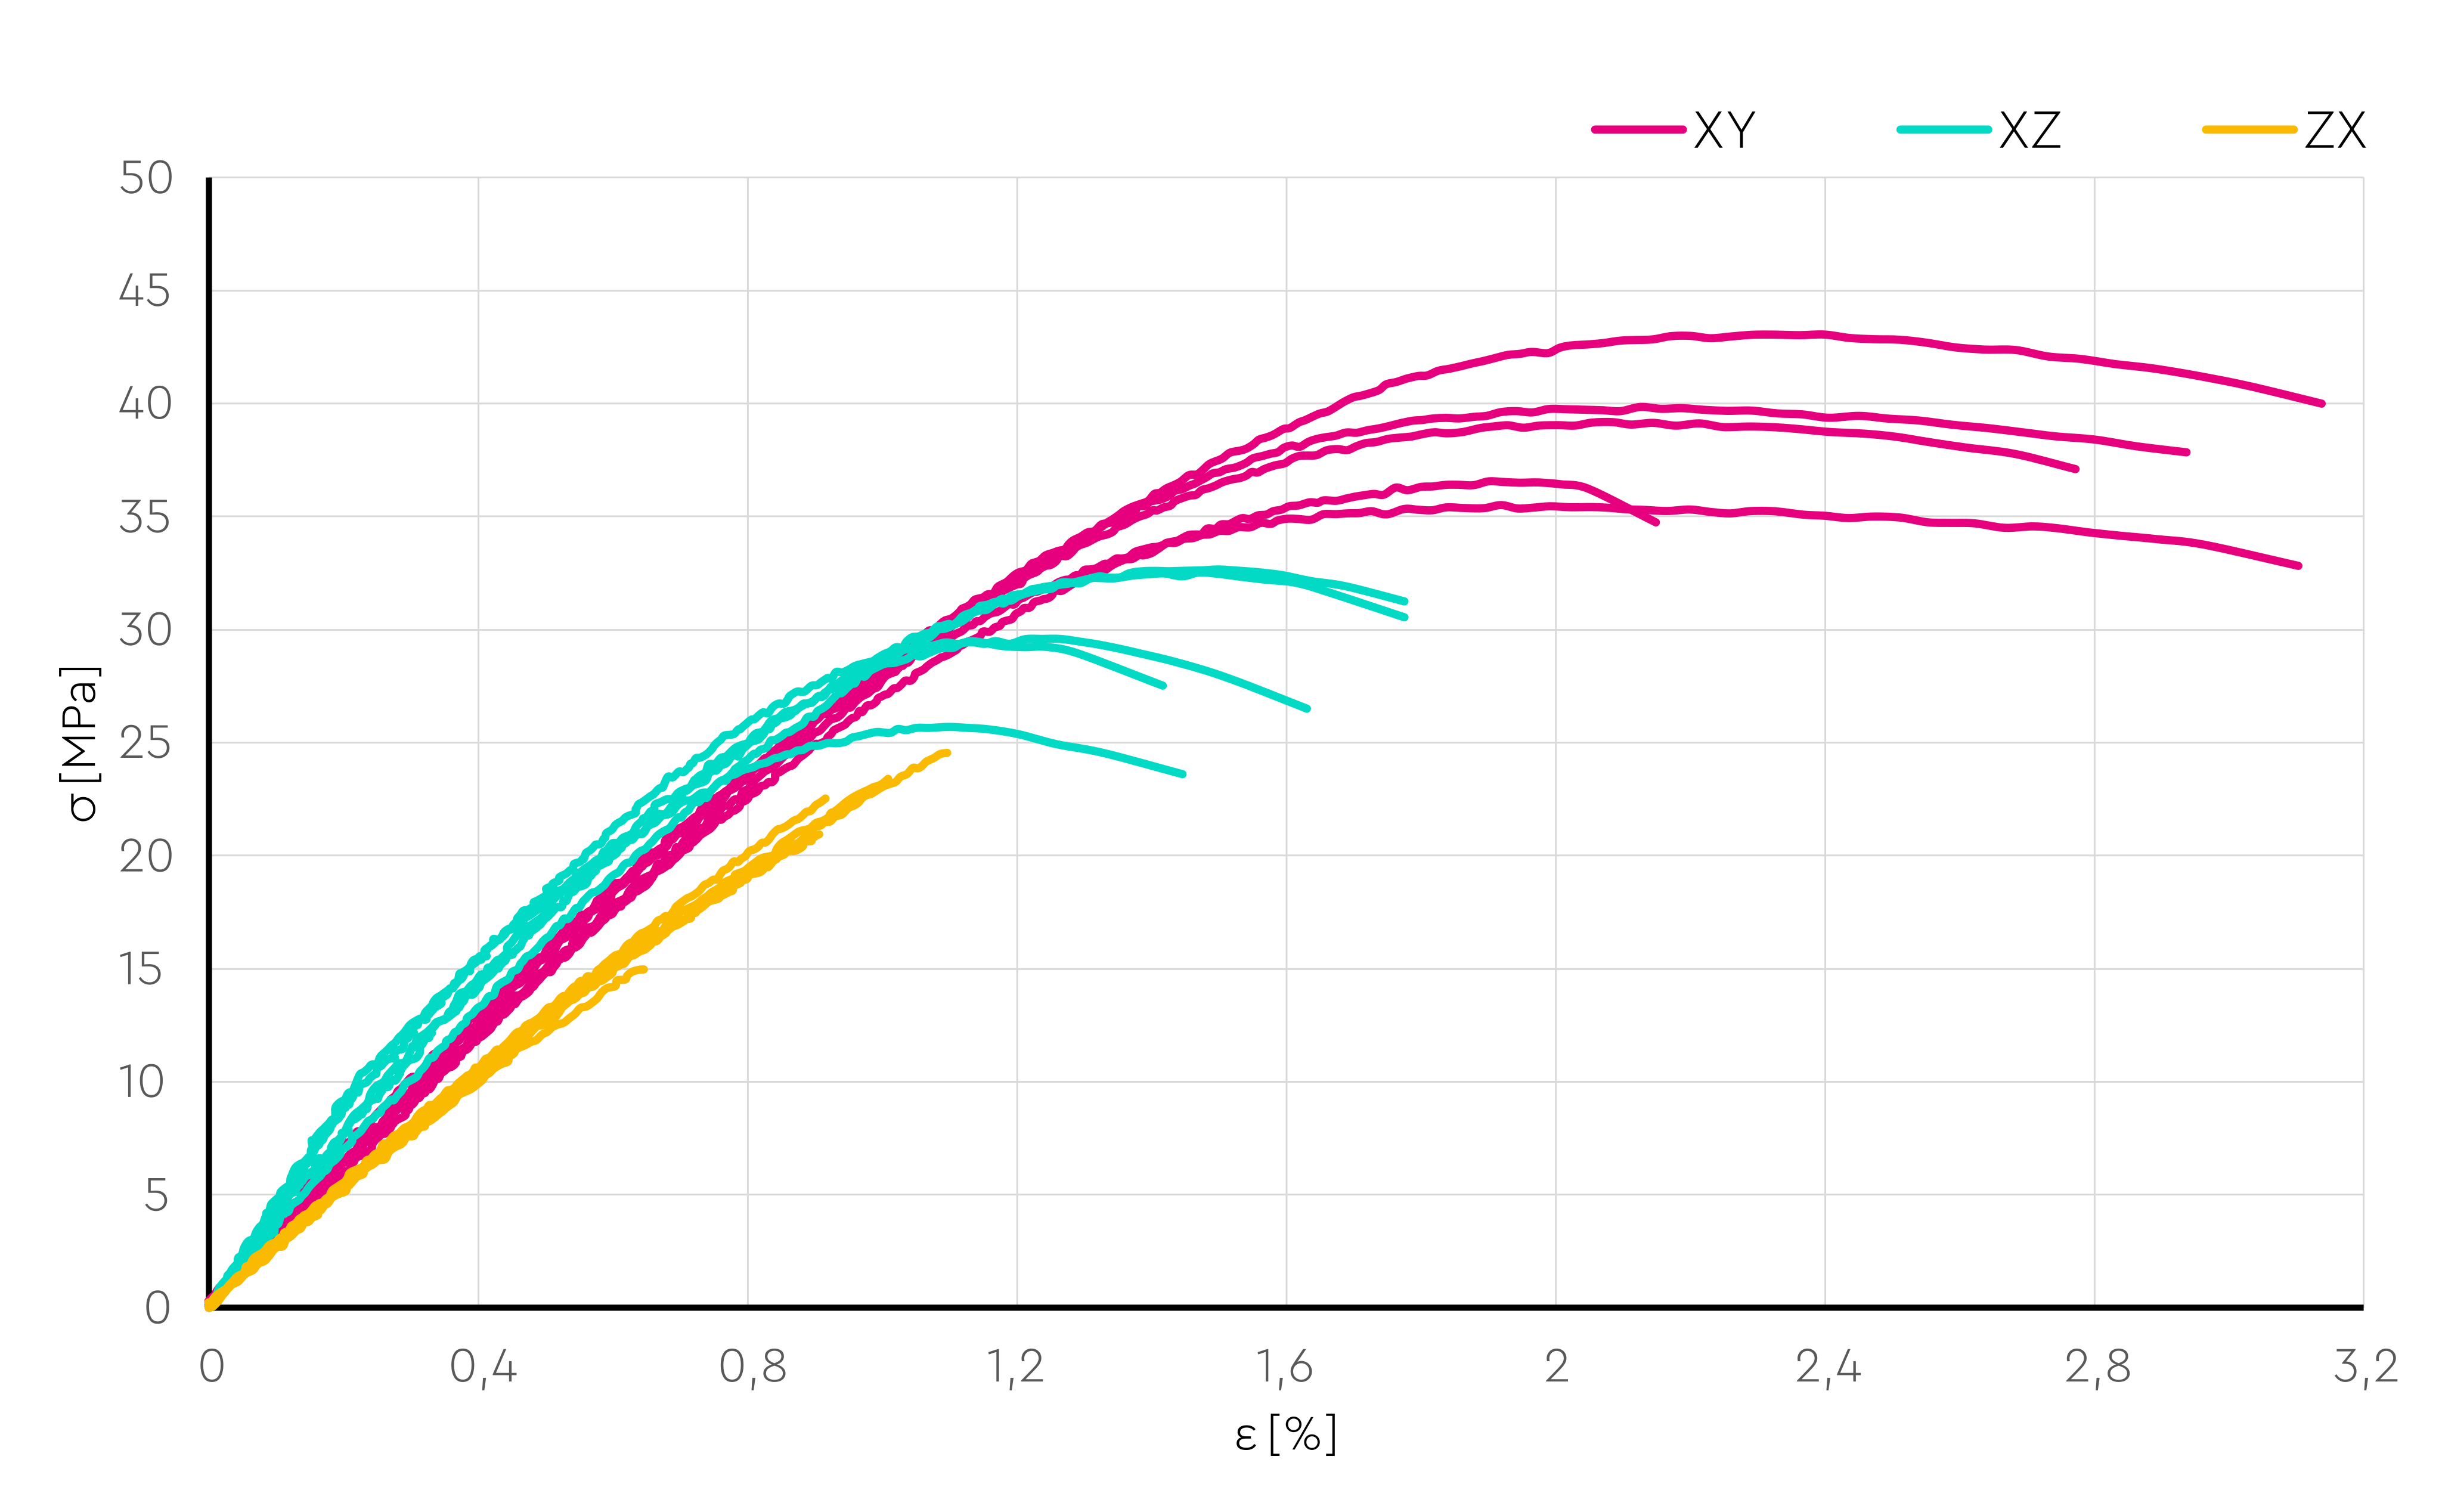
E [GPa] (PLA):
XY: 2.93 ± 0.05
XZ: 3.15 ± 0.05
ZX: 2.36 ± 0.09
E [GPa] (PETG):
XY: 1.58 ± 0.02
XZ: 1.76 ± 0.09
ZX: 1.41 ± 0.02
This application was done in cooperation with Institute of Manufacturing Technology at Brno University of Technology as a part of Master’s Thesis.
 Download PDF version of this report here