
Thermo-mechanical fatigue testing of miniature specimens
Thermo-mechanical fatigue (TMF) testing evaluates material behavior under simultaneous cyclic mechanical loading and changing temperatures. It is used to assess fatigue life, cyclic stress–strain response, hysteresis behavior, and damage development under conditions that closely represent demanding real-world service environments.
Three main damage mechanisms contribute to thermo-mechanical fatigue:
- creep – time-dependent material deformation at elevated temperatures
- fatigue – crack initiation and propagation caused by repeated mechanical loading
- oxidation – environmental degradation of the material surface, which can increase brittleness and promote crack formation
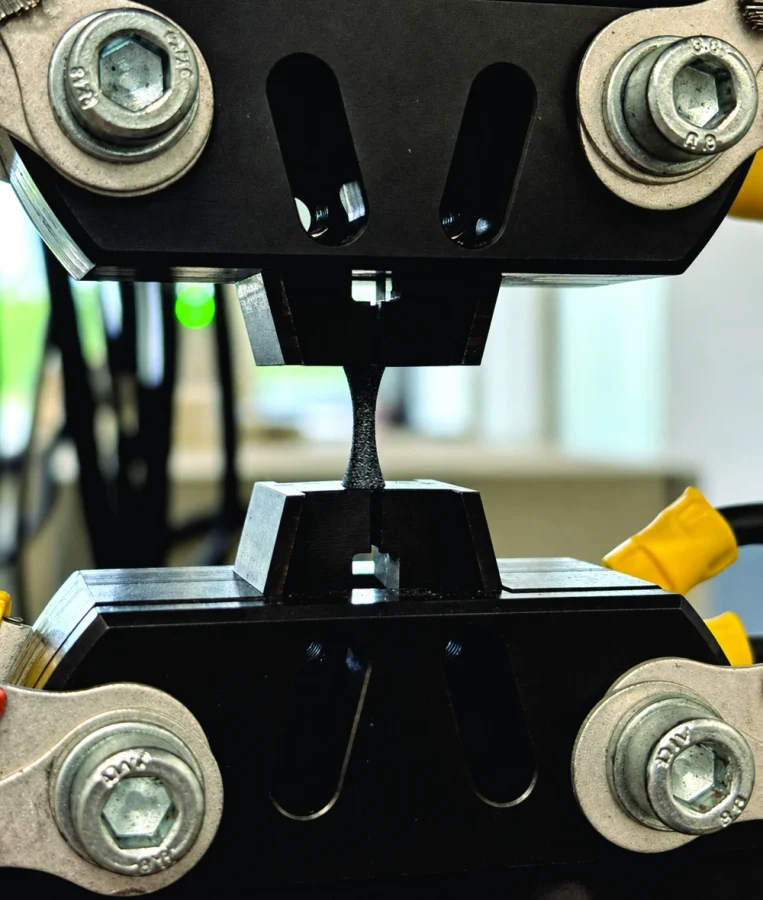
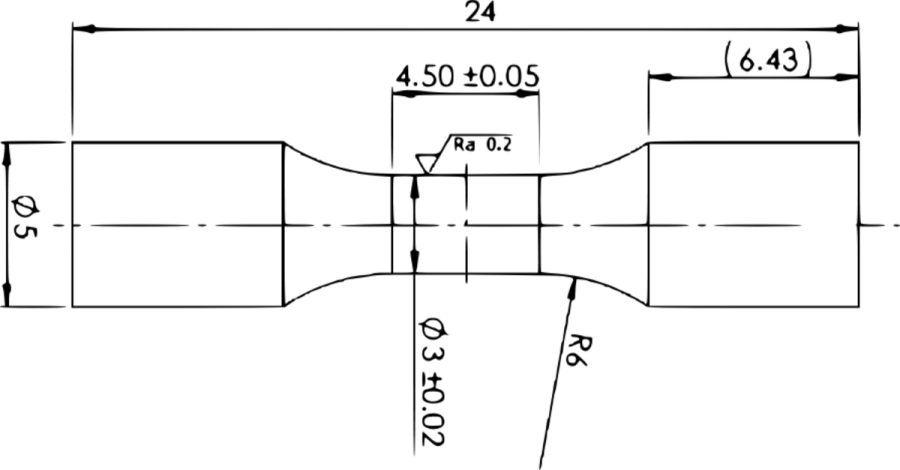
The tests were first performed on cylindrical specimens with a 10 mm diameter and a 20 mm gauge length. The test specimen with a speckle pattern is represented in Figure 1. Subsequently, miniaturized specimens with a 4 mm diameter and a 4.5 mm gauge length were manufactured for validation purposes, as shown in Figure 2.
KEYWORDS
- Thermo-mechanical fatigue (TMF)
- High-temperature measurement
- Thermo-physical testing
- Combined loading
- Thermal cycling
TEST SET-UP


OUTPUT
- Stress-strain hysteresis loop
- S-N (Wöhler) curve
- Thermal image recording
Measurement Process and Tools
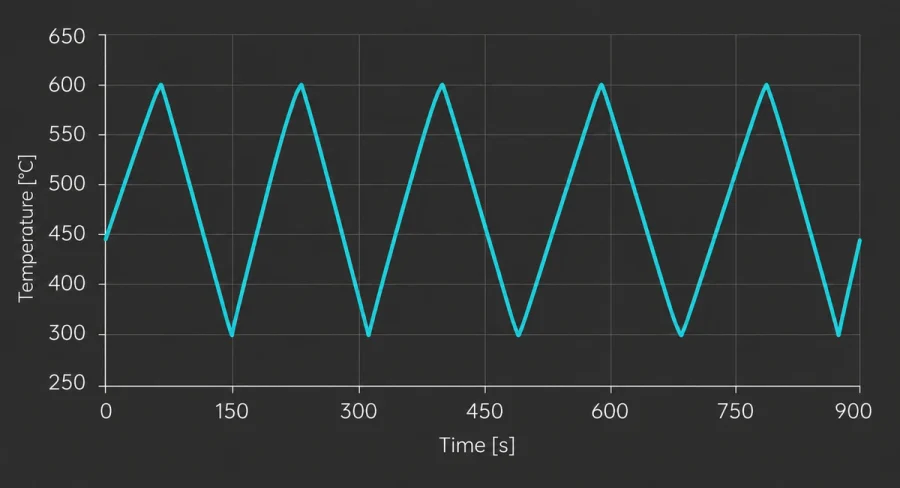
The test plan for the axial–torsional TMF experiments covered a temperature range of 300 to 600 °C and included a total of six loading combinations (K1–K6), representing different combinations of axial and torsional deformation within this temperature range under proportional (PRO) and non-proportional (NPR) loading conditions. A linear sawtooth waveform with a frequency of 0.005 Hz was used to provide sufficient time for specimen cooling during the relevant half-cycle. The maximum axial strain, ε, or equivalent strain, εeq, was limited to 1 %.
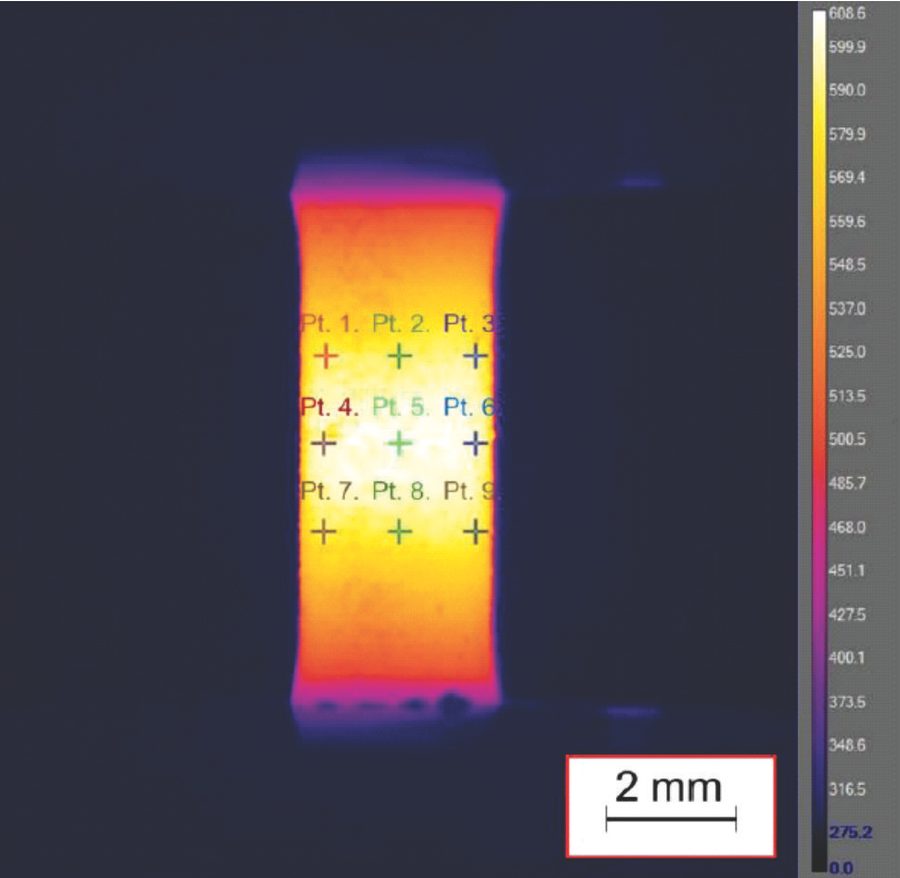
The temperature distribution within the active region of the test specimen must meet the required conditions to ensure reliable experimental data. Closed-loop temperature control was performed using a non-contact infrared camera (see Figure 3). The average temperature profile over the 300–600 °C range at a test frequency of 0.005 Hz is presented in Figure 4.
The measurements were performed using Alpha DIC software together with the Line Probe and Torsion Line Probe tools. Since the telecentric lens defines both the working distance and the field of view, the system is pre-calibrated prior to testing. Furthermore, a thermal camera was integrated into Alpha DIC through the Thermomechanical (TM) module.
Measurement Evaluation
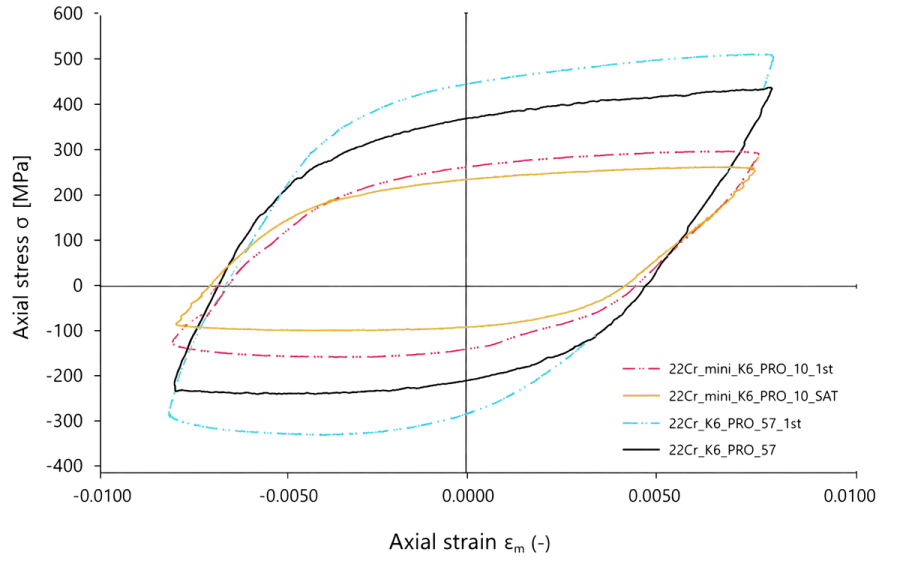
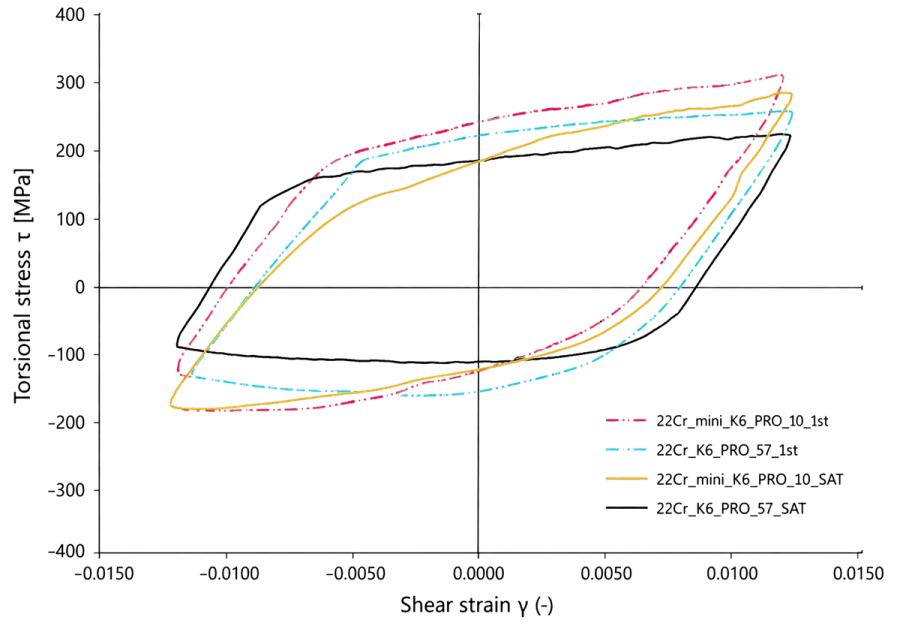
Standard and miniaturized specimens were compared under K2 loading (in-phase axial tension–compression loading, see Figure 5) and K6 loading (proportional combined axial–torsional loading, see Figure 6 with both measuring probes), with the evaluation focused on the the number of cycles to fracture and resulting hysteresis loops.
The setup enables acquisition of several mechanical quantities, including axial strain, change in length, twist angle, and shear strain, together with an external temperature input. The thermal-camera view can be displayed directly within the measurement interface via a Picture-in-picture extension Thermomechanical panel, allowing the optical deformation data and thermal information to be monitored together during the test.
When miniaturized specimens are used under combined axial–torsional loading conditions, the measured response can be evaluated directly without the need for additional correlation relationships. This enables the axial and torsional deformation components to be determined independently from the optical measurement and subsequently combined for evaluation of the multiaxial material response. The same measurement approach can be applied directly to miniaturized specimens without introducing specimen-size-specific correction factors.
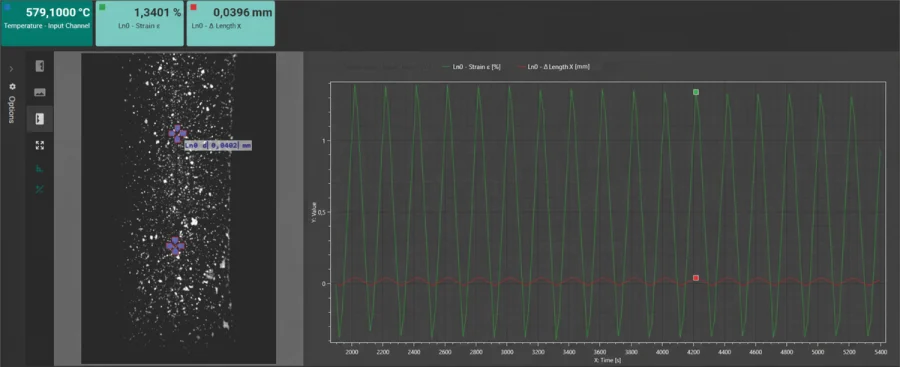
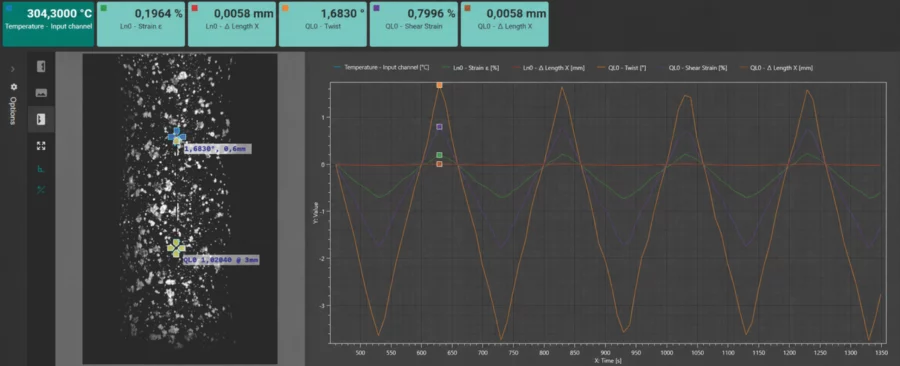
The evaluation included the stabilized cyclic response at N and the fatigue life expressed as the number of cycles to SAT failure N . The results are listed in Table 1.
| Specimen | NSAT | Nf |
|---|---|---|
| K2_49 | 59 | 177 |
| Mini_K2_2 | 59 | 178 |
| Mini_K2_6 | 60 | 137 |
| K6_PRO | 80 | 135 |
| Mini_K6_PRO | 74 | 193 |
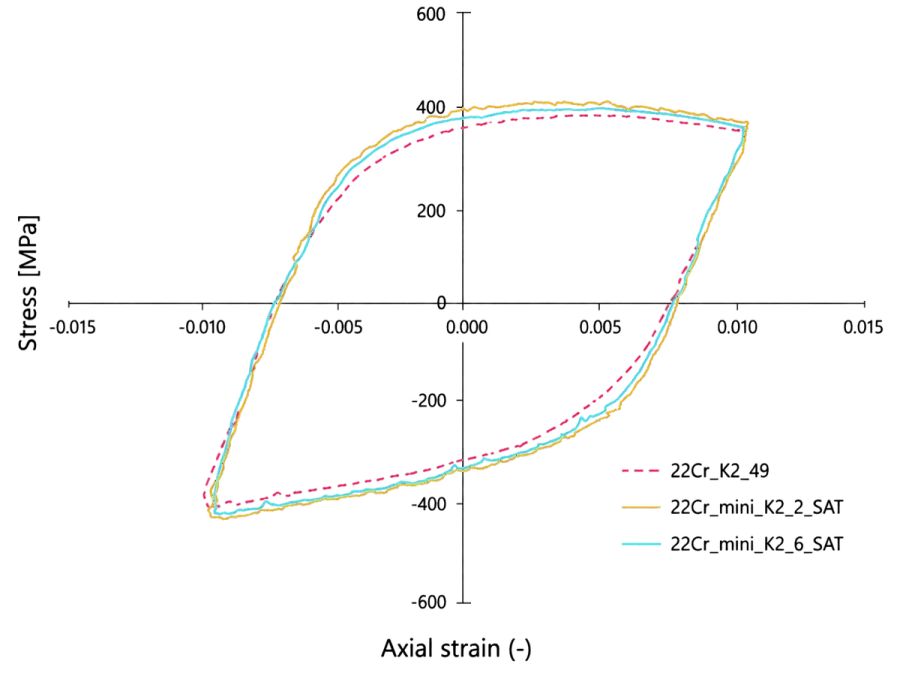
The hysteresis loops were used to demonstrate the cyclic mechanical response of standard and miniaturized specimens. The comparison provides information on stress amplitude, cyclic hardening or softening, and energy dissipation during each loading cycle. A close agreement between the hysteresis loops indicates that the miniaturized specimens reproduce the cyclic response of the standard specimens, whereas systematic differences may indicate a specimen-size effect or increased sensitivity to local material and testing conditions.
 Download PDF version of this report here