STRAIN CONCENTRATION ON A NOTCHED SAMPLE: DIC VS. FEM
KEYWORDS
- 2D measurement
- Tensile load
- Notched sample
- Strain distribution
- Strain concentration
TEST SET-UP
- Single 9 MPx camera
- 60 mm photographic lens
- Alpha DIC® modules: DIC, CL
- Measuring tools:
- DIC Area
- Crack Probe
- DIC Area
- Dogbone steel sample with a central notch
OUTPUT
- Full-field strain distribution
- Line distribution of inhomogeneous strain

The planar steel sample in the “dogbone” shape under tensile load was used to demonstrate the possibilities of obtaining the strain distribution on the surface of the sample to quantify the strain concentration caused by the central hole acting as a notch. Then, the results obtained by the DIC were compared with the FEM calculation.
For the purpose of this application, the 2D DIC system containing a 9 MPx camera and a 60 mm photographic lens was used to achieve sufficient resolution at the higher working distance of the system. Uniform illumination was ensured by symmetrically placed lights. A speckle pattern was created on the surface of the sample to enhance the image correlation.
After the system was set up, calibration was performed using the calibration grid. For the test, the tensile testing machine was used.

WHY CHOOSE X-SIGHT?
- Strain analysis software Alpha DIC® – simple to use but complex in features
- Strain easily measurable anywhere on the specimen’s visible surface
- Localization of strain concentration
- Versatile real-time measurements and powerful post-processing
TOOLS, POSTPROCESSING AND RESULTS
The DIC area tool was used in the area surrounding the notch, where the strain field deviates from the homogeneous strain in the rest of the sample. The full-field axial strain distribution was captured. Additionally, a FEM calculation was performed with boundary conditions that faithfully represent the test setup.
Only half of the area surrounding the notch was depicted as the axial symmetry is applicable.
The results obtained by both methods correspond very well qualitatively and quite well quantitatively.
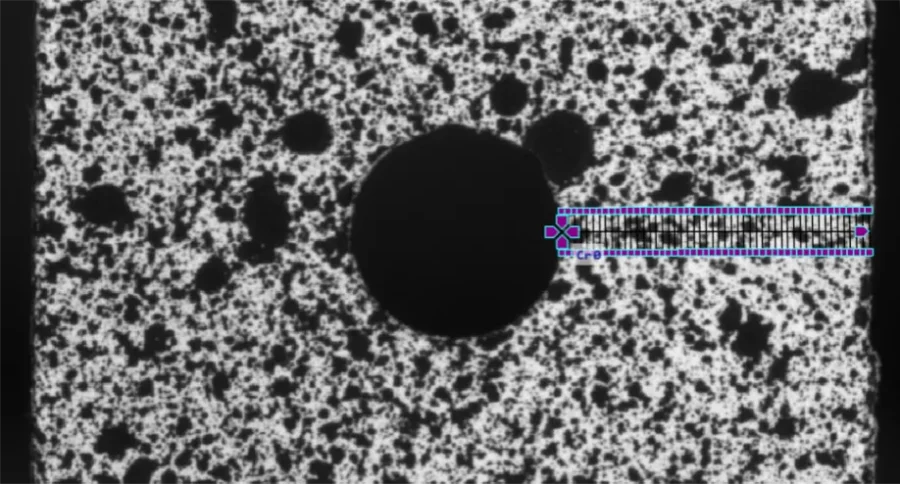
The crack probe was used to obtain the line strain distribution in the section where the strain concentration was expected.
The probe creates an arbitrary number of line probes perpendicular to the line that connects the starting and ending points of the probe (distinctly purple in the image). The results graph shows a good match between the DIC and FEM results, with the exception of the maximum value, where the strain gradient is the highest, which influenced the calculated value of the strain concentration factor.
| Technique | DIC | Analytical | FEM |
| Strain concentration factor | 2.16 | 2.33 | 2.30 |


Strain curves comparison
🗎 Download PDF version of this report here