Determining Forming limit curves using DIC
KEYWORDS
- Nakajima Test
- Digital Image Correlation
- Forming limit curve (FLC)
- Forming limit diagram (FLD)
- ČSN EN ISO 12004-2
TEST SET-UP
OUTPUT
- Forming Limit Diagram
- Section Analysis
- Major–Minor Strain Behaviour

Sheet metal forming is a key manufacturing technology in modern mechanical engineering, used to produce thinwalled components with high dimensional accuracy and tailored mechanical properties. As industries strive for lighter and more efficient structures, accurately defining the formability limits of sheet metal blanks has become increasingly important.
These limits are typically represented by Forming Limit Diagrams (FLDs), which illustrate how the material behaves under different combinations of stretching and compression. They make it possible to predict when and where the material will fail during forming. To determine these limits experimentally, engineers often use the Nakajima test, in which specimens are subjected to
various stress states until fracture.
This project, conducted as part of a student thesis, involved the design and validation of a custom test fixture in full compliance with ISO 12004-2. The deformation of the specimens during loading was measured using stereoscopic (3D) Digital Image Correlation (DIC), a noncontact optical method that provides highly precise, fullfield strain data.
Specimens and Measurement setup
Before measurement, a set of metallic sheet specimens made from DR 520 CA with a nominal thickness of 0.2 mm was
prepared. The aim was to generate various stress states during the Nakajima-type forming test. To achieve this,
geometrically distinct specimens were designed (see Fig. 2), comprising:
- Flat specimens (strips) with widths of 40 mm, 50 mm, 60 mm, 70 mm, and 90 mm
- Circular specimens with a diameter of 155 mm

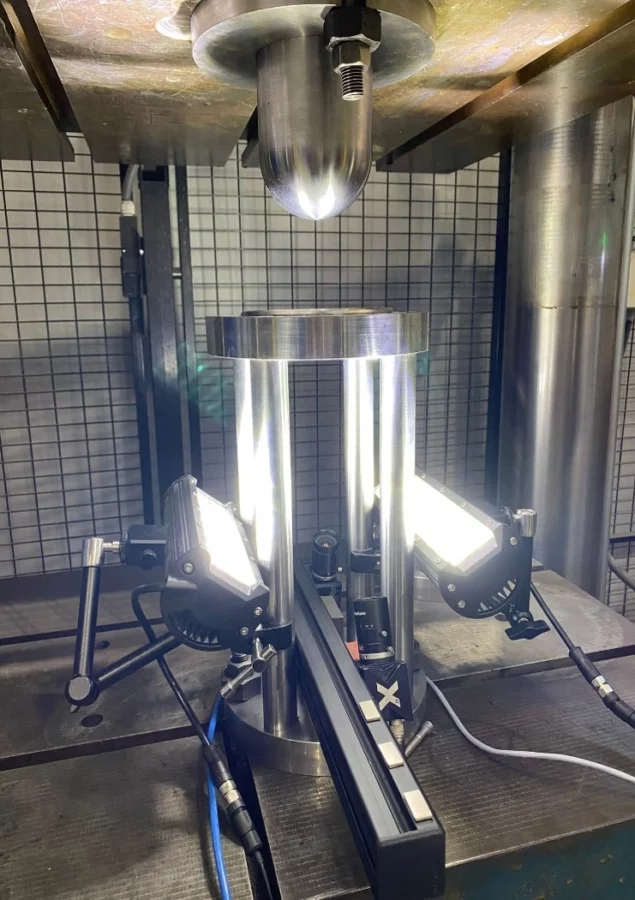
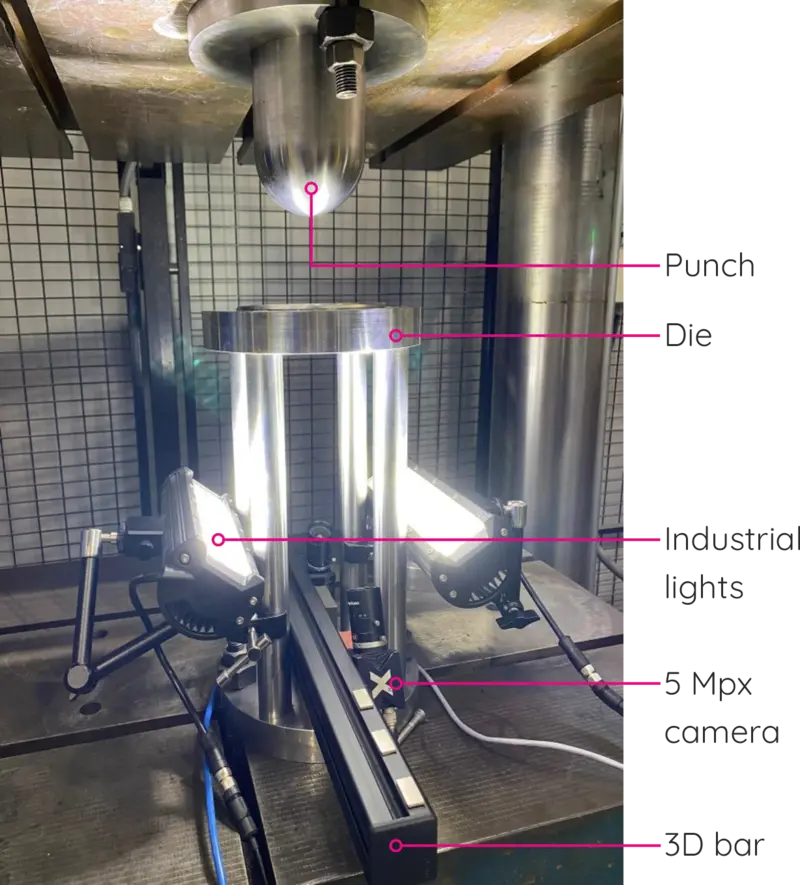
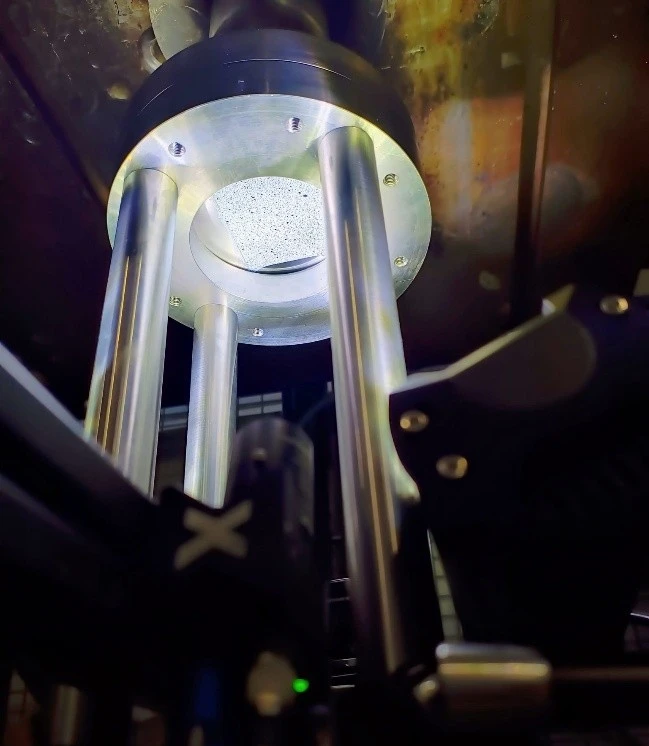
Each specimen geometry was manufactured in three identical pieces to ensure repeatability and allow statistical evaluation of the test results. The forming tests were carried out using a custom experimental fixture designed for compatibility with the Digital Image Correlation (DIC) method, which integrates all standard forming components, including a punch, die, drawbead, and blank holder. In addition, vertical spacers were incorporated to elevate the tooling assembly, providing a clear optical path for the DIC system positioned beneath the specimen.
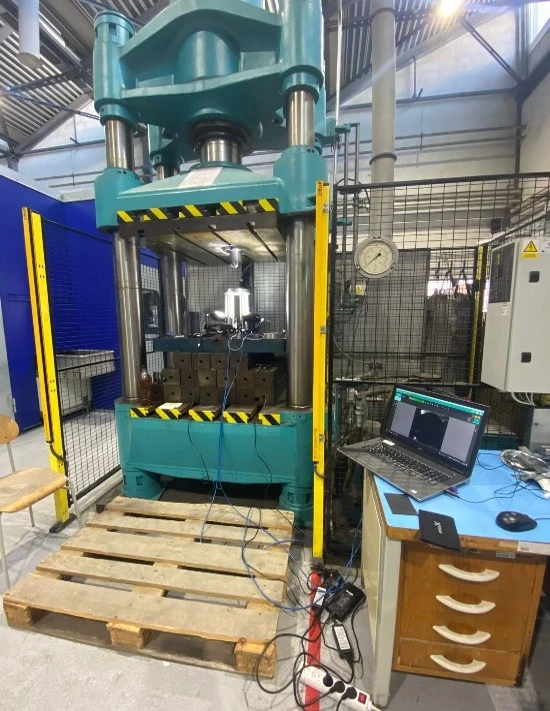
The complete fixture was installed on a CBJ 500–6 hydraulic press, which supplied the required forming force. Following the mechanical setup, the X-Sight 3D DIC system was deployed. The entire measurement process was controlled and evaluated using the X-Sight Alpha DIC software. A full view of the prepared measurement setup is shown in Fig. 3.
Measurement
Before testing, a thin layer of lubricant was applied to both the specimen surface and the hemispherical punch to reduce friction, promote smoother deformation, and minimize the risk of surface damage. In addition, the DIC system was calibrated prior to measurement.
At the beginning of the testing phase, each specimen was carefully positioned on the drawbead support of the forming fixture and secured with the blank holder. To ensure uniform clamping pressure, two temporary spacers were inserted between the upper fixture plate and the blank holder, which was then lightly tightened with four screws to achieve preliminary contact with the specimen. Afterwards, the spacers were removed and the blank holder was fully tightened using four additional screws. All fasteners were torqued in a cross pattern to prevent distortion or asymmetric loading, ensuring stable and repeatable specimen fixation (Fig. 5).
The forming process began with the punch moving downward, gradually applying pressure to the specimen to simulate realistic sheet metal forming conditions. Throughout the deformation, the X-Sight stereoscopic DIC system continuously recorded the full-field 3D displacement and strain evolution.
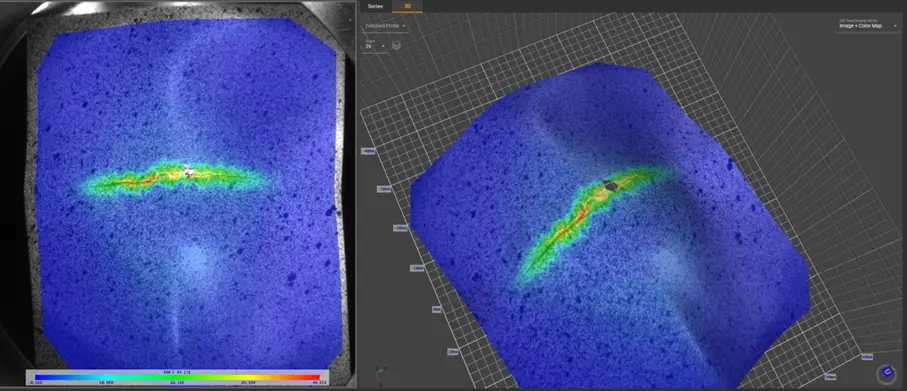
The test was terminated at the onset of material failure, as detected in the Alpha DIC software (see Fig. 6), which was defined by the appearance of a crack in the specimen. After fracture, the specimen was carefully removed and stored for post-test evaluation.This procedure was repeated for all specimens to ensure repeatable and consistent results across the entire test series.
Measurement evaluation
Measurement evaluation This section presents the evaluation of data obtained from experimental measurements. For clarity, a single representative specimen—sample 70a, corresponding to a strip with a width of 70 mm—was selected. The complete evaluation procedure is demonstrated on this specimen.
The analysis was performed in Alpha DIC using its basic post-processing tools and the Forming Limit Curve (FLC) module for advanced evaluation. This module enables detailed section-based analysis in full compliance with ISO 12004-2 (see Fig. 7).
At the location of failure—typically visible in the strain map as a red-colored region indicating maximum strain—a measurement plane was positioned and oriented along the crack direction. Perpendicular to this plane, three centerlines were defined, each representing a conceptual cross-sectional cut through the crack area. Along each centerline, the software automatically evaluated the strain distribution, from which the major and minor engineering strain values (ε1 , ε2 ) were extracted. These strain values were then converted to true (logarithmic) strains (φ1, φ2), as required for constructing the FLCs. Additional sections could be added for further evaluation if necessary.
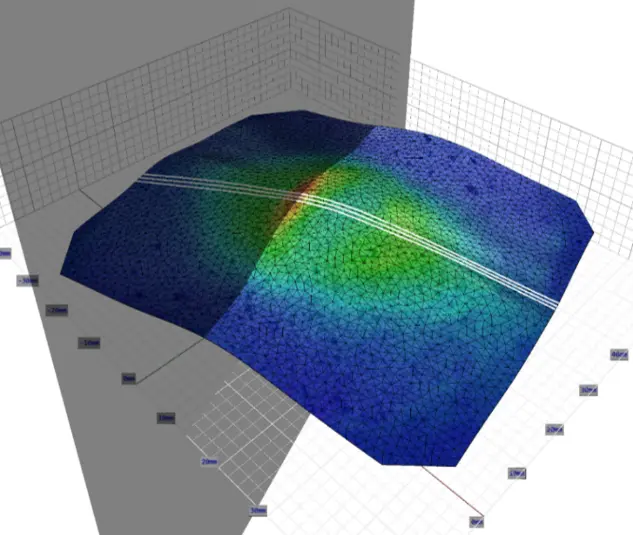
The evaluation was conducted at two critical time points: immediately prior to crack initiation and after crack initiation. This dual-point analysis was selected because the primary goal of these tests was to support the development of an advanced material model for forming simulations, which requires an in-depth evaluation of the material behavior.
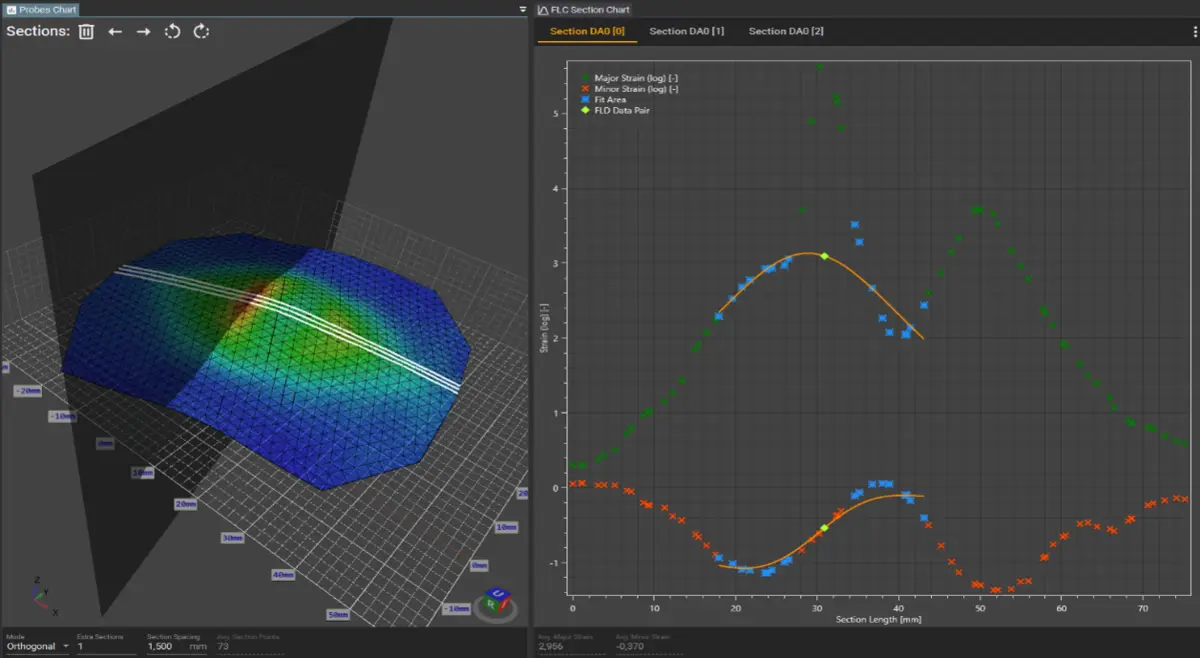
The FLC module also allows the user to apply an automatic polynomial fit (see Fig. 8), which significantly accelerates the evaluation process. However, this approach involves the use of a safety coefficient and therefore does not represent the true material limits required for material model development. For this reason, the maximum measured values from both evaluation time points were used in the material model, as described in the following sections.
After crack initiation evaluation
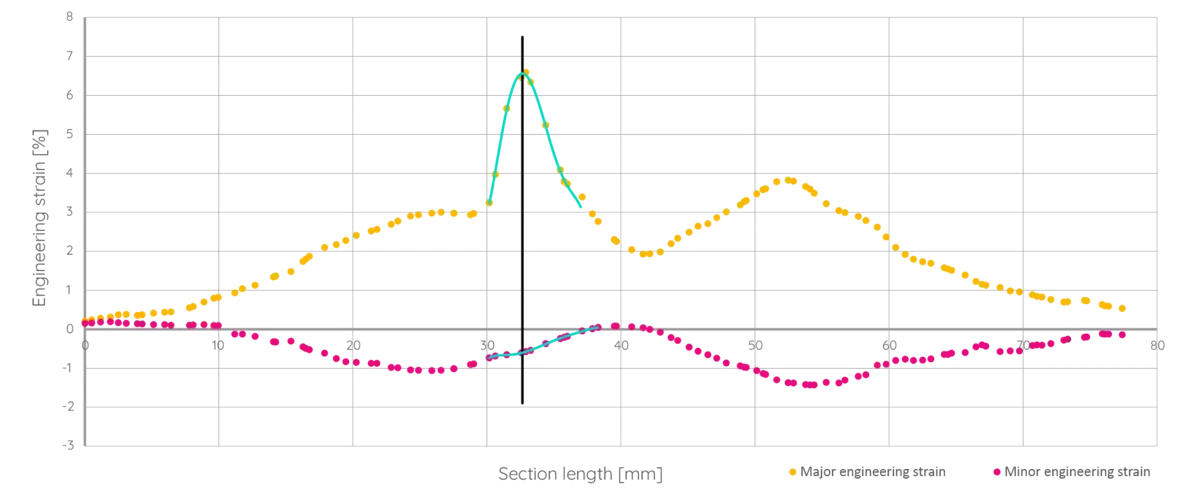
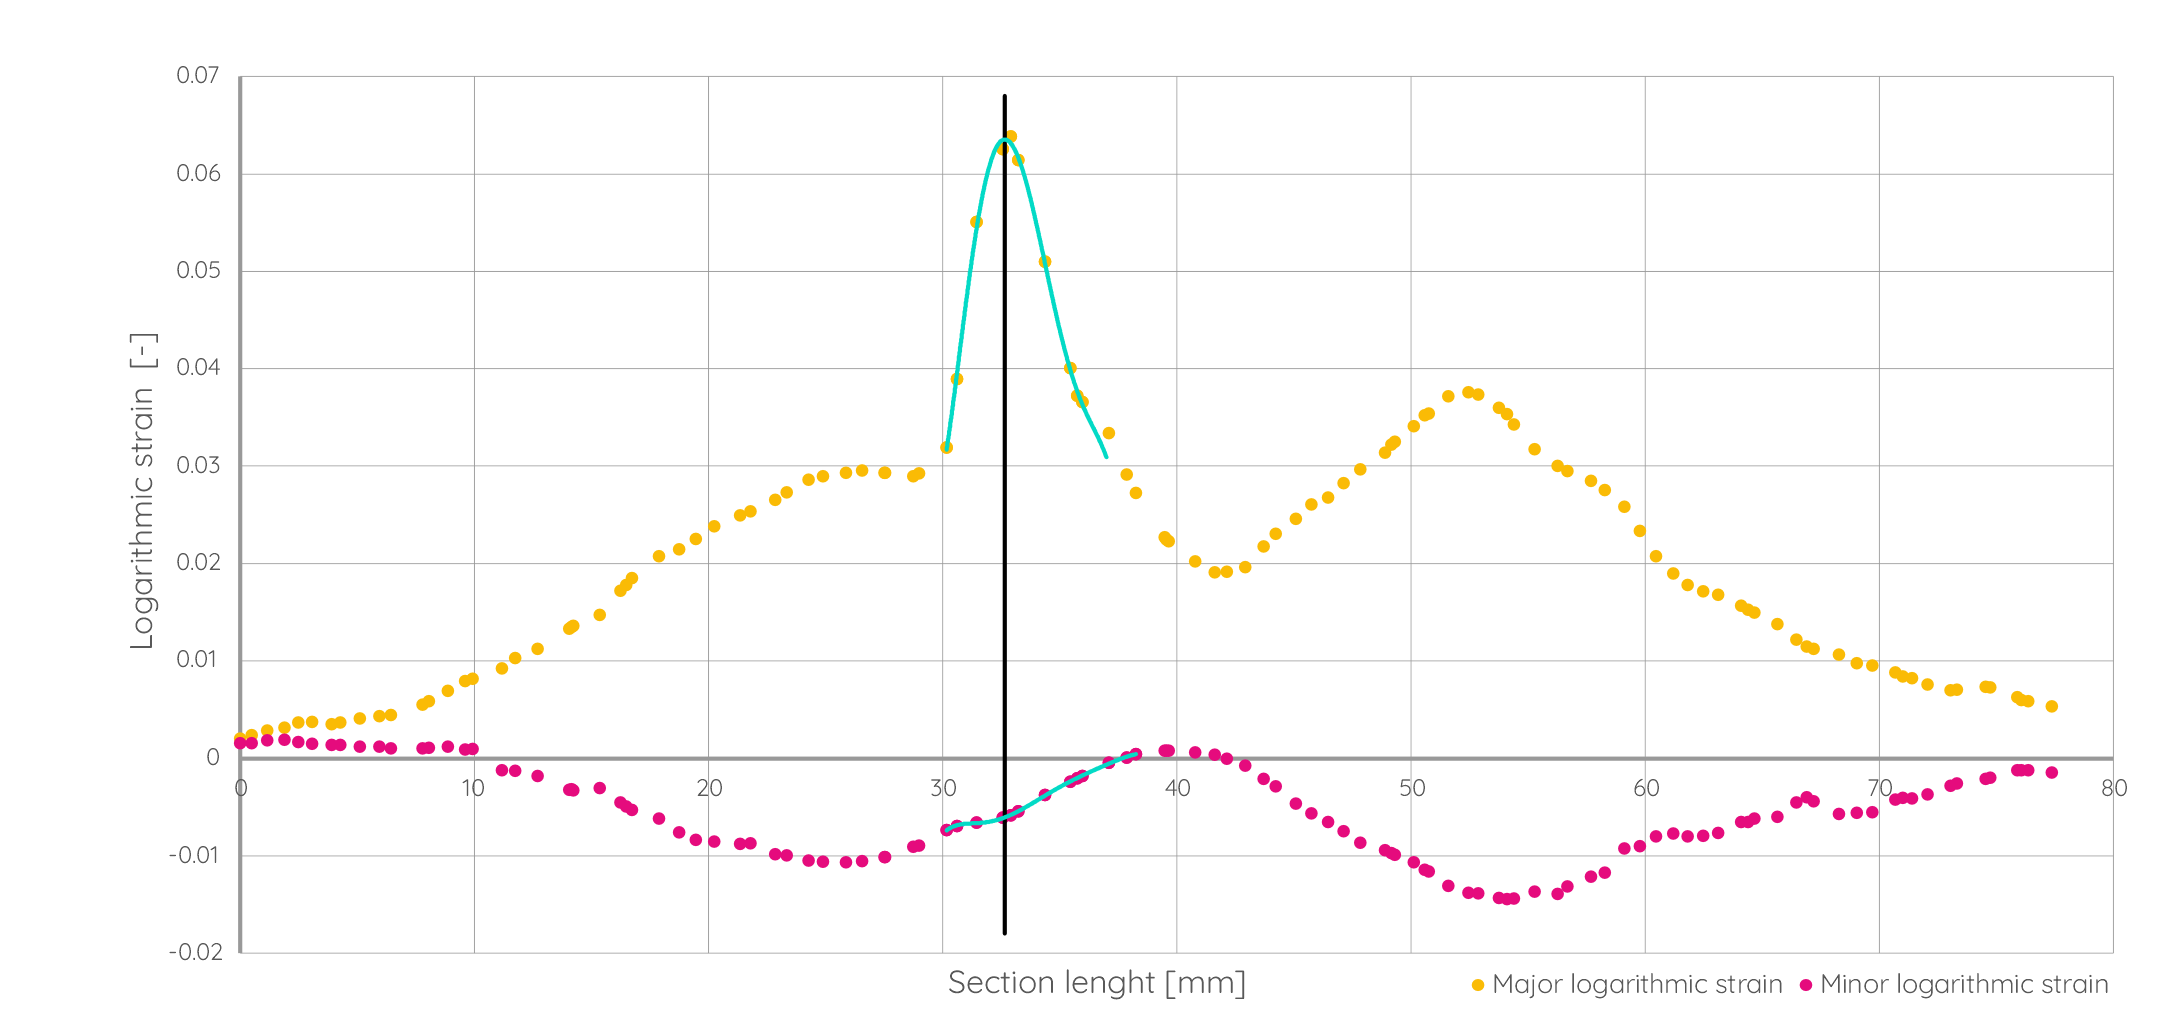
Figure 10 corresponds to the middle centerline and shows the engineering strain profile along the section cut through the crack area. Two data curves are presented:
- The yellow curve represents the distribution of major strain.
- The pink curve shows the distribution of minor strain.
The crack center is marked by a vertical black line, indicating the location of maximum strain, which corresponds to the material’s limit point. In accordance with ISO 12004-2, a smoothing polynomial regression was applied to the strain data near the crack zone (green curve in Fig. 9), enabling a more precise determination of the local maximum of major strain. Its intersection with the vertical black line defines this maximum and the corresponding minor strain value.
To provide a complete view of the deformation state, Figure 10 presents an equivalent graph constructed using the logarithmic (true) strain.
Strain values extracted from all tested specimens, summarized in Table 1, were used to construct the FLC representing the boundary between safe deformation and material failure.
| Specimen no. | ɛ1 | ɛ2 | φ1 | φ1 |
|---|---|---|---|---|
| 40a | 8,391 | -0,845 | 0,0806 | -0,0085 |
| 40b | 8,386 | -0,836 | 0,0805 | -0,0084 |
| 40c | 8,379 | -0,857 | 0,0805 | -0,0086 |
| 50a | 5,303 | -0,167 | 0,0517 | -0,0017 |
| 50b | 5,294 | -0,147 | 0,0516 | -0,0015 |
| 50c | 5,311 | -0,155 | 0,0517 | -0,0016 |
| 60a | 8,309 | -0,841 | 0,0798 | -0,0084 |
| 60b | 8,292 | -0,828 | 0,0797 | -0,0083 |
| 60c | 8,301 | -0,835 | 0,0797 | -0,0084 |
| 70a | 6,584 | -0,608 | 0,0638 | -0,0061 |
| 70b | 6,558 | -0,589 | 0,0635 | -0,0059 |
| 70c | 6,602 | -0,614 | 0,0639 | -0,0062 |
| 90a | 5,305 | -0,407 | 0,0517 | -0,0041 |
| 90b | 5,320 | -0,417 | 0,0518 | -0,0042 |
| 90c | 5,286 | -0,394 | 0,0515 | -0,0039 |
| 155a | 21,308 | 7,188 | 0,1932 | 0,0694 |
| 155b | 21,277 | 7,215 | 0,1929 | 0,0697 |
| 155c | 21,322 | 7,235 | 0,1933 | 0,0699 |
Before crack initiation evaluation
To determine the material’s limit state, a single frame from each test series was selected—captured immediately before failure. This frame represents the critical condition corresponding to the highest material stress.
The evaluation was performed in the Alpha DIC software using the color map of major engineering strain. A pinkmarked point (Figs. 11 and 12) in the region of the future crack identified the global maximum of major strain (ε1 = 15.116%) in both the strain map and the section diagram within the FLC evaluation interface. This point was located
within the red deformation zone (Fig. 11), approximately 4 mm from the specimen center.
Unlike the major strain, which typically peaks directly at the crack center, the global maximum of minor strain (ε2,max =−1.845%) occurred in a blue-colored area unrelated to the actual failure location. Therefore, its evaluation had to be carefully focused on the crack initiation site to ensure that the resulting strain pair (ε1, ε2) reflected the material’s true
limit state and could be used to construct the FLC. The corresponding value (ε2 = −0.555%) was thus obtained from the map of minor engineering strain (Fig. 12) using the same mesh settings and evaluation point (pink square).
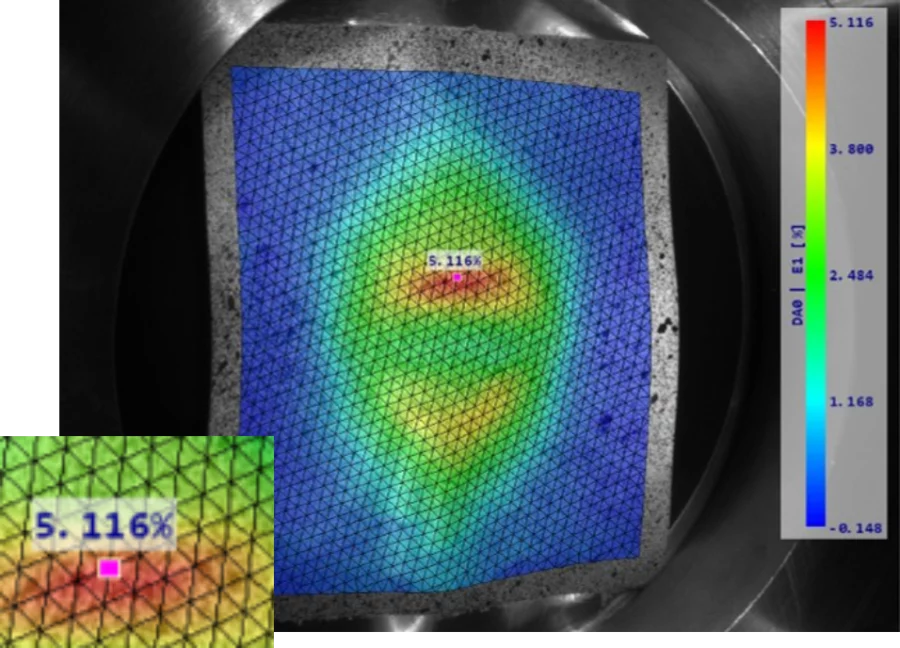
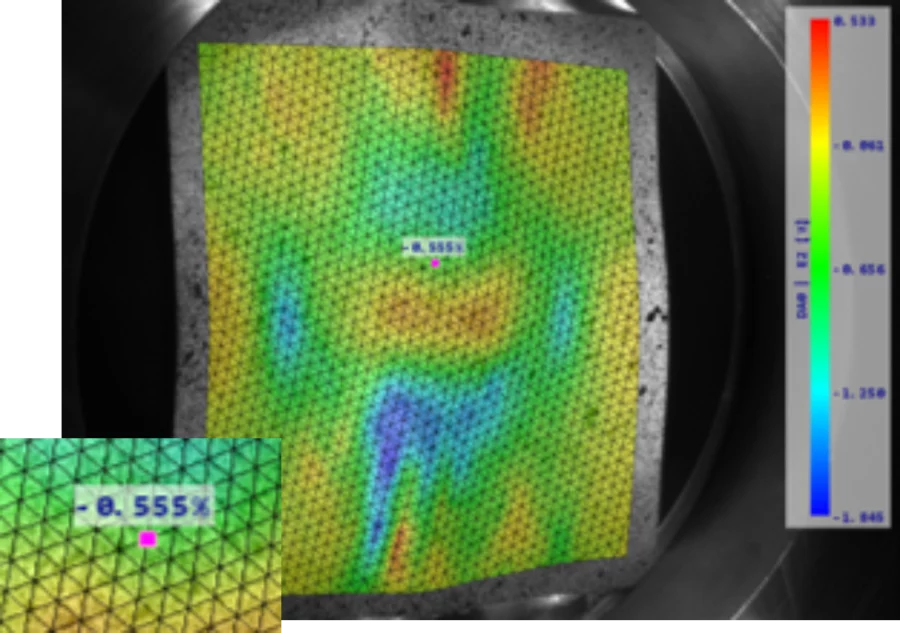
All specimens were analyzed using this procedure—first identifying the local maximum of the major strain (ε1), and then determining the corresponding minor strain (ε2) at the same location within the future crack region. The engineering strain pairs were subsequently converted to logarithmic strains, denoted as φ1 and φ2. A complete overview of all obtained values is provided in Table 2.
| Specimen no. | ɛ1 | ɛ2 | φ1 | φ1 |
|---|---|---|---|---|
| 40a | 6,569 | -0,820 | 0,0636 | -0,0082 |
| 40b | 6,586 | -0,815 | 0,0638 | -0,0082 |
| 40c | 6,519 | -0,829 | 0,0632 | -0,0083 |
| 50a | 5,219 | -0,497 | 0,0509 | -0,0050 |
| 50b | 5,158 | -0,513 | 0,0503 | -0,0051 |
| 50c | 5,285 | -0,479 | 0,0515 | -0,0048 |
| 60a | 5,068 | -0,461 | 0,0494 | -0,0046 |
| 60b | 4,978 | -0,475 | 0,0486 | -0,0048 |
| 60c | 5,181 | -0,457 | 0,0505 | -0,0046 |
| 70a | 5,116 | -0,555 | 0,0499 | -0,0056 |
| 70b | 5,209 | -0,539 | 0,0508 | -0,0054 |
| 70c | 5,092 | -0,561 | 0,0497 | -0,0056 |
| 90a | 4,840 | -0,207 | 0,0473 | -0,0022 |
| 90b | 4,901 | -0,218 | 0,0478 | -0,0021 |
| 90c | 4,779 | -0,205 | 0,0467 | -0,0022 |
| 155a | 14,764 | 8,138 | 0,1377 | 0,0782 |
| 155b | 14,821 | 8,255 | 0,1382 | 0,0793 |
| 155c | 14,747 | 8,201 | 0,1376 | 0,0788 |
Before crack initiation evaluation
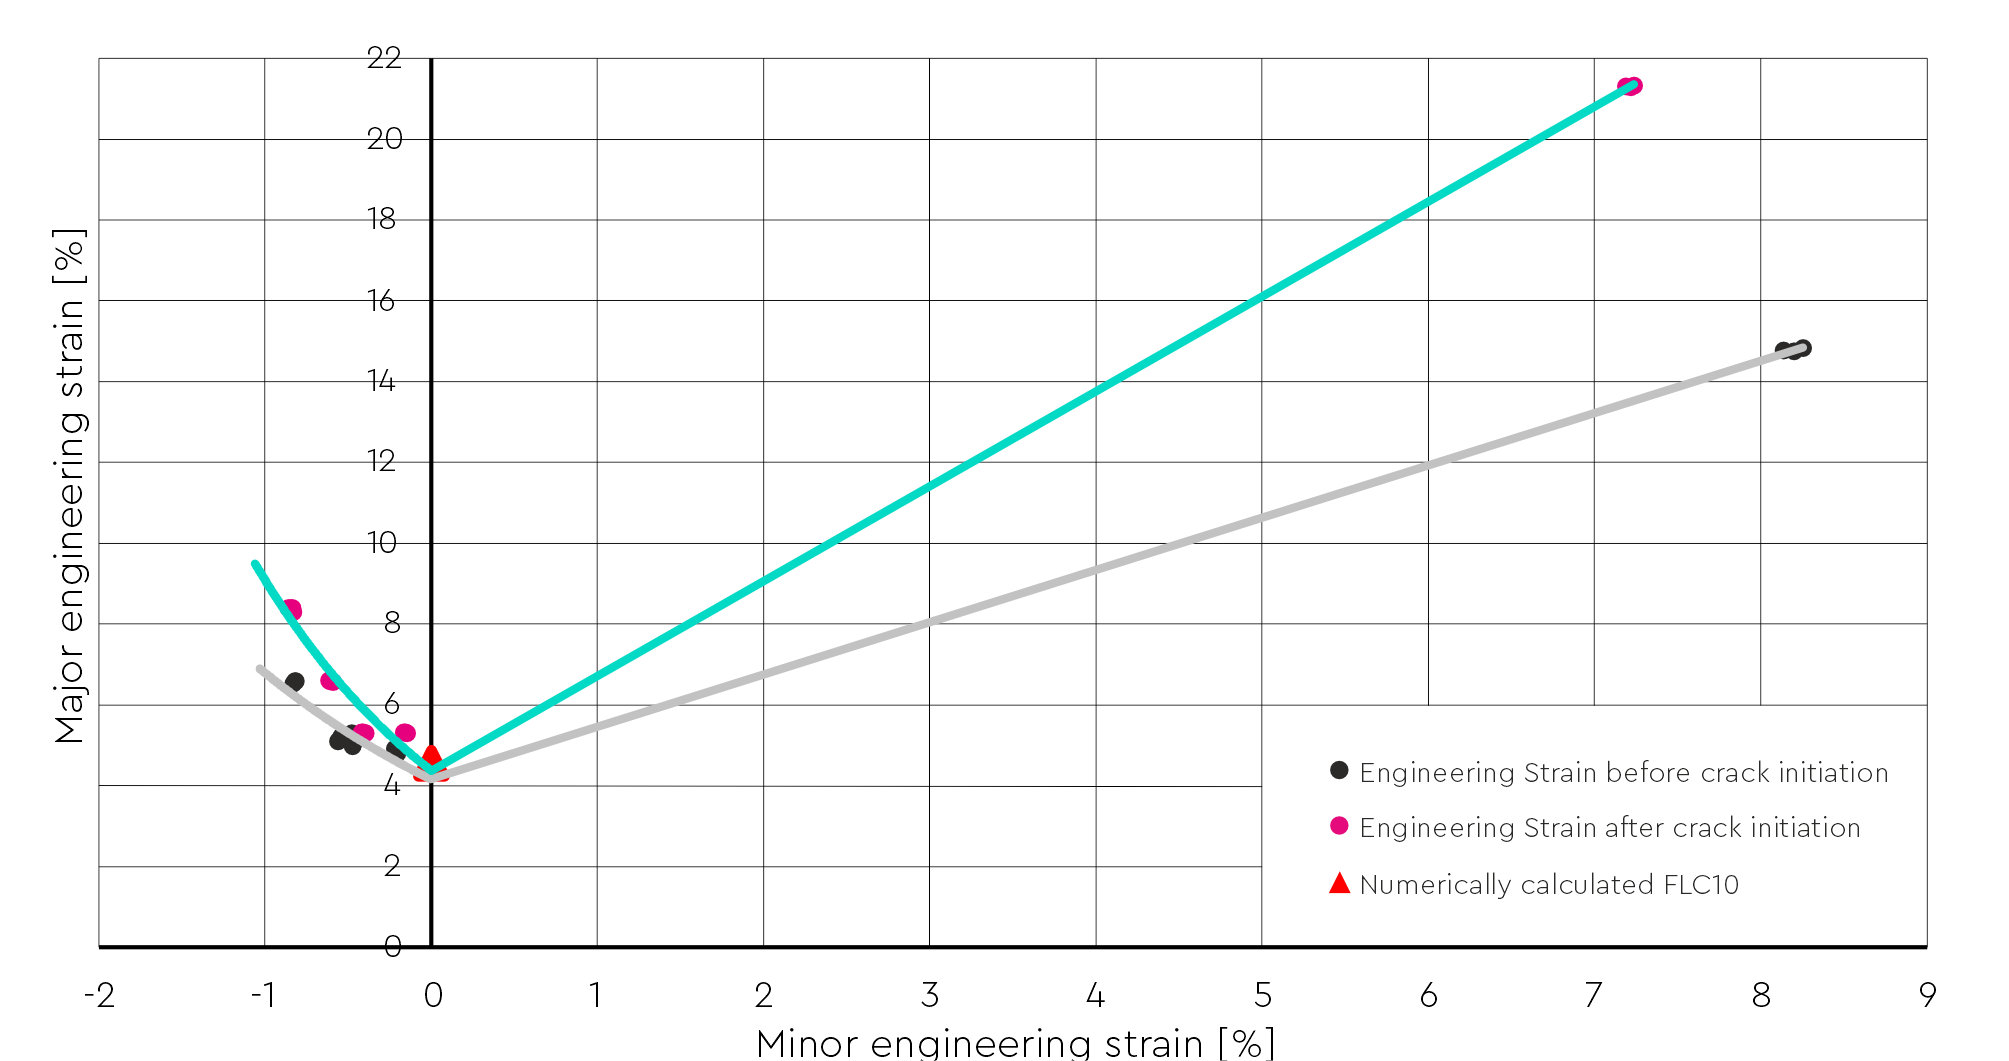
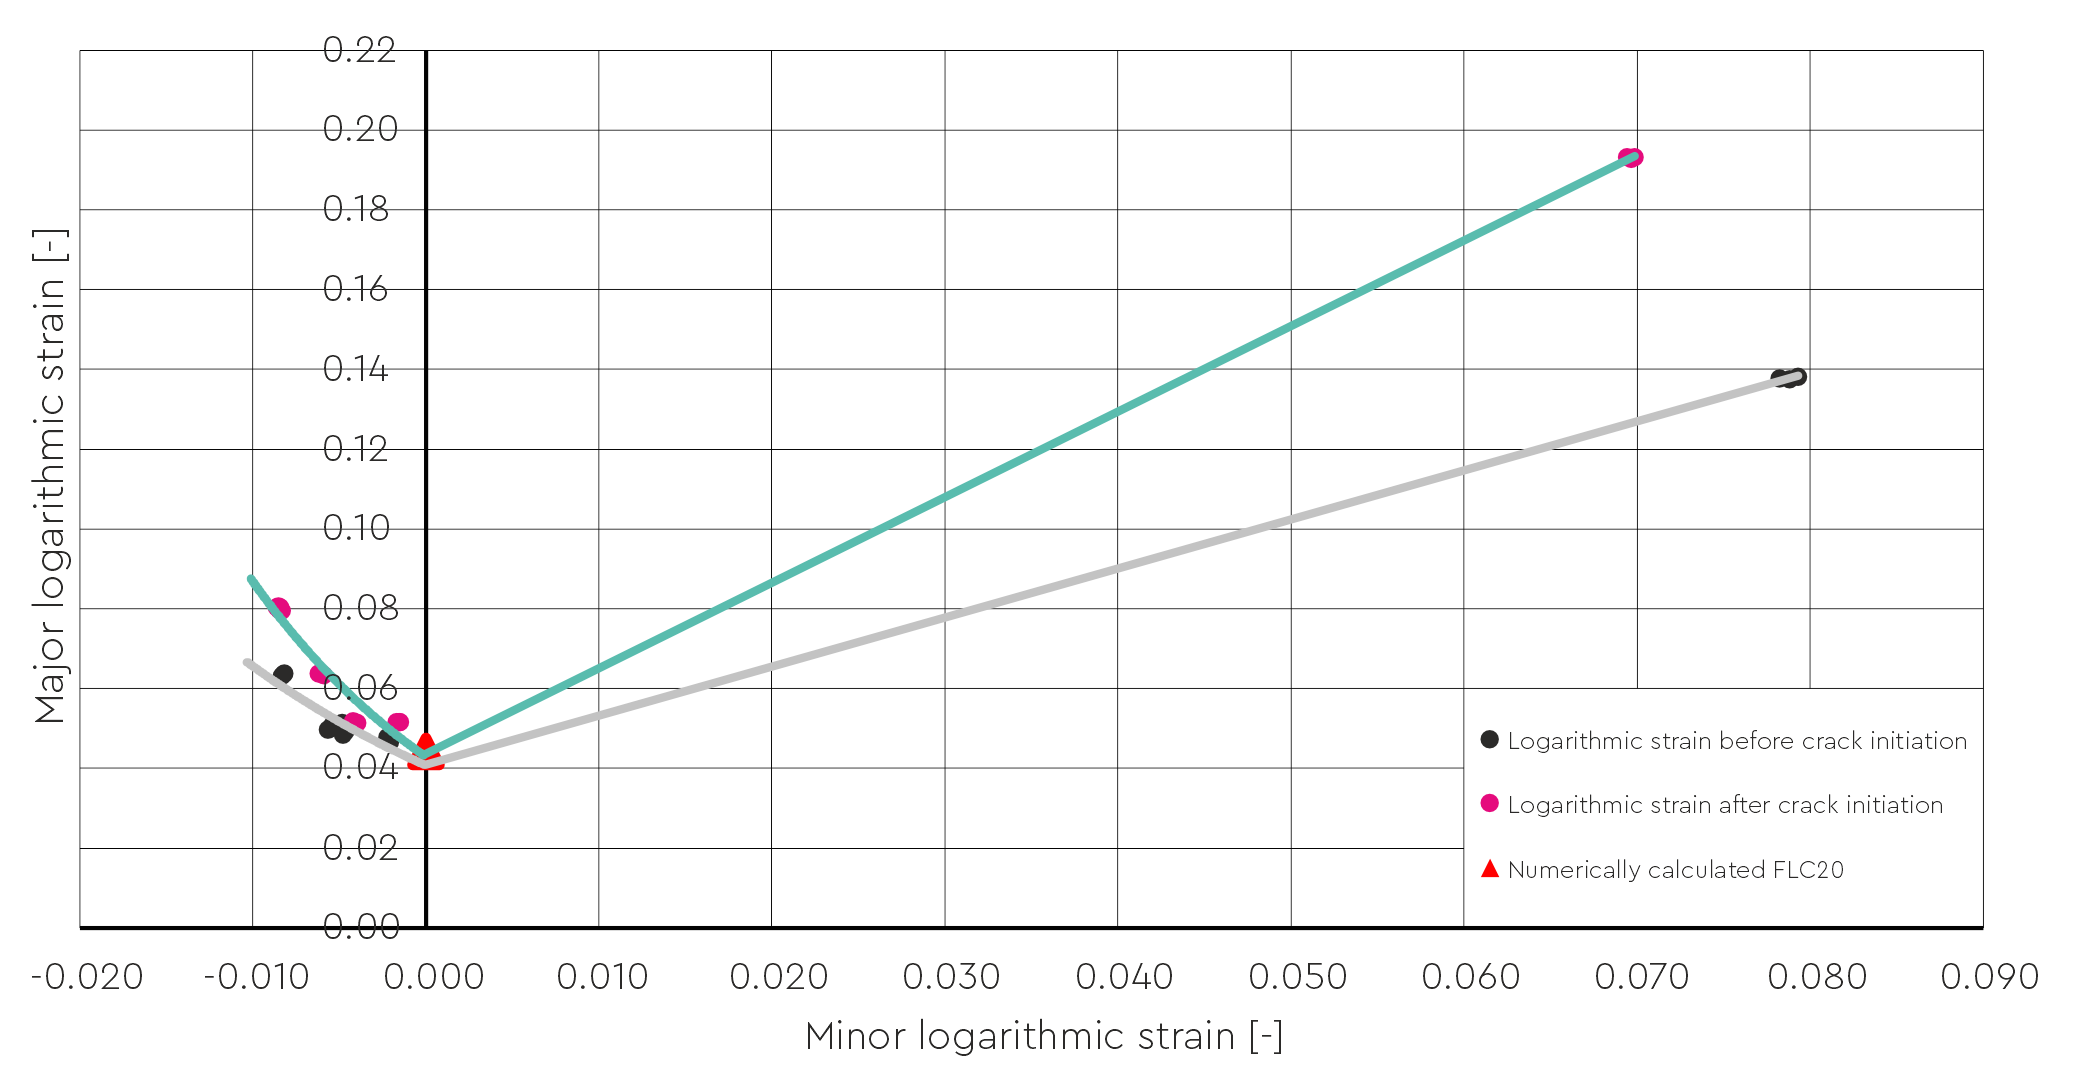
The FLD was first constructed using engineering strains, as shown in Figure 13. In this graph, pink points represent strain values obtained immediately after specimen failure. These points were fitted with two distinct functions:
- a polynomial function on the left side of the diagram, and
- a linear function on the right side.
The resulting green curve defines the FLC of the material — a boundary beyond which permanent material damage occurs.
An identical approach was applied to the data from the pre-fracture phase, shown as black points. Fitting these data points produced the grey curve, which represents the FLC for the state of the material without visible failure.
Both curves were verified using the calculated reference point FLC₁₀ = 4.6%, representing the uniaxial tensile state (ε₂ = 0) and marked in the diagram with a red triangle. Their close intersection near this point confirms the validity of the experimental and analytical procedures, demonstrating that the results accurately reflect the material’s true behavior and comply with the applicable international standard.
Figure 14 shows the equivalent FLD constructed in the same way using logarithmic strains from Tables 1 and 2, and the reference point FLC₂₀ = 0.045.
Download PDF version of this report here